Discussion 討論區 <<
Previous Next >> Plotting libraries in Python 用Python繪製庫
When to make plots 什麼時候作圖
We use plots to convey information. From this histogram:
我們使用圖來傳達信息。根據此直方圖:
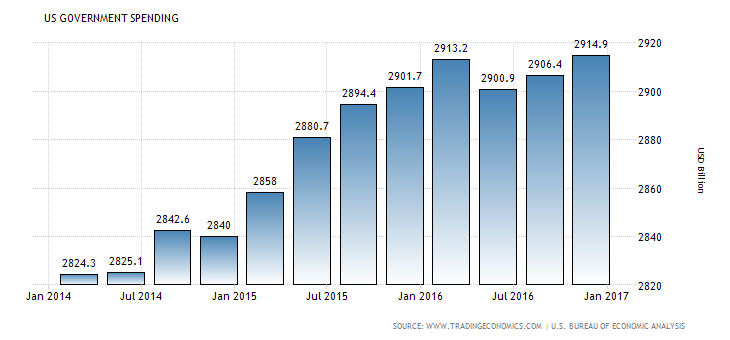
You can immediately see that the US government spending has been steadily increasing, reaching a peak in January 2017.
So learning how to make plots will help you become better at displaying and communicating information, both to yourself and to others.
美國政府支出直方圖
您可以立即看到,美國政府支出一直在穩定增長,在2017年1月達到峰值。
因此,學習如何繪製情節將有助於您更好地顯示和與自己以及他人交流信息。
Discussion 討論區 <<
Previous Next >> Plotting libraries in Python 用Python繪製庫